CAGR explained: from a total increase to a yearly growth rate
Reading time: 5 min · 7 sections
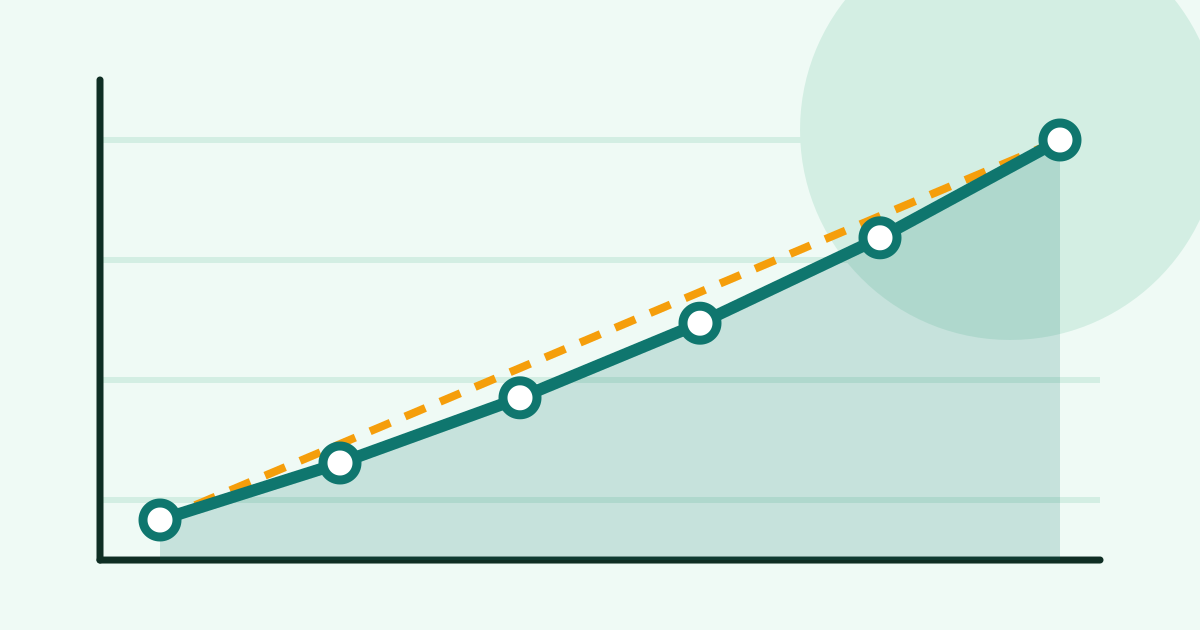
Revenue grew 70.83% over five years, so it grew 14.17% a year: that is the sentence I correct most often in reports. Dividing a total by the number of years ignores compounding. The honest yearly figure is the compound annual growth rate, CAGR, and for this example it is 11.30%.
CAGR answers one question: what single, steady yearly rate would take the starting value to the final value over the same time? It is the average annual growth rate that analysts quote for revenue, users, savings or prices. The percentage increase calculator returns it when you fill in the time span (years, quarters or months) next to the old and new values, and draws the path with a table of the value at each step. Here is the method behind it.
The CAGR formula
Here n is the number of periods between the two values, usually years. The definition is the same one given in the Wikipedia article on compound annual growth rate: the mean annualized growth rate of a value that compounds, smoothing out the ups and downs on the way.
Take 100 growing to 150 in 3 years:
- Ratio: 150 ÷ 100 = 1.5.
- Third root: 1.51 ÷ 3 = 1.14471.
- Subtract one: CAGR = 14.47% a year.
- Check: 100 × 1.14471 × 1.14471 × 1.14471 = 150.
The shortcut answer, 50% ÷ 3 = 16.67% a year, overshoots. Grow 100 by 16.67% three times and you reach 158.8, not 150. The shortcut ignores that each year's growth is earned on a bigger base than the one before it.
A worked example with a year-by-year table
Revenue goes from 240,000 to 410,000 over 5 years. The total is 410,000 ÷ 240,000 − 1 = 70.8333%. The ratio is 1.708333, and its fifth root is 1.11305, so CAGR is 11.3050% a year. The simple "total ÷ years" figure is 14.17%, which overstates by nearly three points. Applying the steady rate year by year rebuilds the path exactly:
| Year | Value | Gain over previous year |
|---|---|---|
| 0 | 240,000.00 | |
| 1 | 267,131.91 | +27,131.91 |
| 2 | 297,331.07 | +30,199.16 |
| 3 | 330,944.23 | +33,613.16 |
| 4 | 368,357.34 | +37,413.11 |
| 5 | 410,000.00 | +41,642.66 |
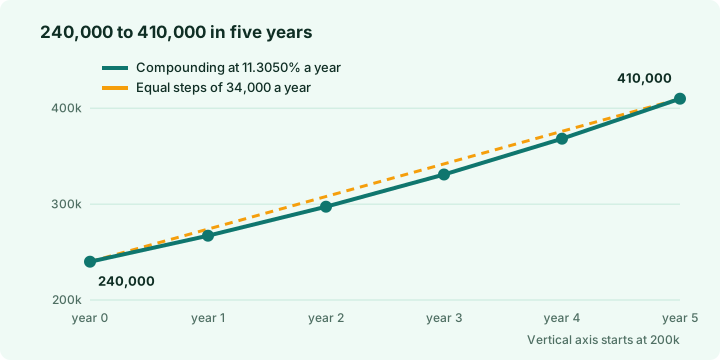
The gain grows every year even though the rate is constant. That is the whole idea of compounding, and it is why a straight average of percentages is the wrong tool.
Count periods, not data points
A frequent error is n. If you have yearly figures for six consecutive years, there are five periods between the first and the last, not six. Draw the timeline and count the gaps. The same goes for months: a value at the start and another at the end of a year is twelve monthly periods.
Monthly growth and converting between months and years
The formula works for any period. Sales going from 1,200 to 1,500 over 12 months is +25%, and the monthly rate is 1.251 ÷ 12 − 1 = 1.8769% a month. To move between the two, compound; do not multiply by 12:
| Monthly rate | Times 12 (wrong) | Compounded yearly |
|---|---|---|
| 0.5% | 6% | 6.1678% |
| 1% | 12% | 12.6825% |
| 2% | 24% | 26.8242% |
Going the other way, a yearly 10% is 0.7974% a month, a touch under the 0.8333% you would get by dividing by twelve. The difference is small for small rates and large for big ones, which is exactly where people trust the shortcut most.
What CAGR hides
CAGR looks only at the first and last value. Two very different journeys can produce the same figure. Both paths below start at 100 and finish at 150 after 3 years, so both have a CAGR of 14.47%:
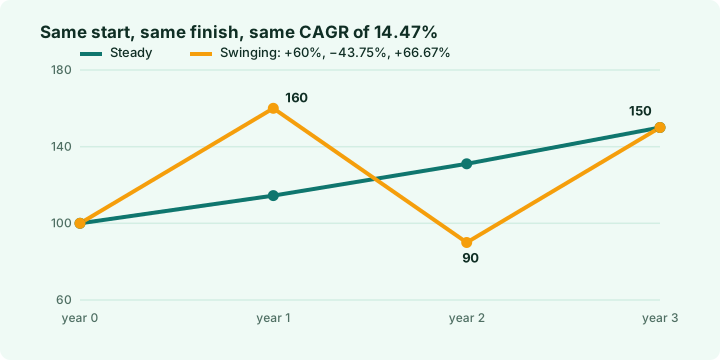
- Volatility disappears. The swinging path, 100 → 160 → 90 → 150, has yearly changes of +60%, −43.75% and +66.67%. Nobody lived through a smooth 14.47%.
- The endpoints are chosen. Move the start or end by a year and the CAGR can change a lot. State both dates or periods when you quote it.
- It is not a forecast. It describes what already happened. Extending it forward is an assumption, not a result.
- It needs positive values. A start or end of zero or less has no CAGR, because there is no ratio to take a root of. The tool says so rather than inventing a number.
CAGR in Excel and Google Sheets
With the starting value in A2, the final value in B2 and the number of periods in C2:
=(B2/A2)^(1/C2)-1Format the cell as a percentage. Excel also has a function named RRI built for this, taking the number of periods, the present value and the future value, and returning the same result. For a plain before-and-after percentage with no time involved, Microsoft's percentage guide covers the standard formulas.
Where CAGR fits with the other measures
CAGR is the right summary when a value compounds over several periods. For a single raise or price rise, a plain percent change is enough: the salary increase guide and the price increase guide show how to compute and reverse those. When the figures are rates rather than amounts, check whether you need points or percent before annualizing anything.
Frequently asked
How do I calculate CAGR?
Divide the final value by the starting value, raise the result to the power of one over the number of periods, and subtract one. 100 to 150 over 3 years is 1.5 to the power of one third, minus 1, which is 14.47% a year.
Why is CAGR not the total increase divided by the number of years?
Because growth compounds: each year grows from a larger base. A 50% total over 3 years is 14.47% a year compounded, not 16.67%, since 16.67% a year for three years would reach about 158.8.
How do I convert a monthly growth rate to a yearly one?
Add one to the monthly rate, raise it to the power of 12 and subtract one. A steady 1% a month is 1.01 to the power of 12 minus 1, which is 12.6825% a year.
Is CAGR a forecast?
No. It summarizes growth that already happened between two points. Real growth moves up and down, and CAGR hides that.
What formula do I use for CAGR in Excel?
With the start in A2, the end in B2 and the number of periods in C2, use =(B2/A2)^(1/C2)-1 and format the cell as a percentage.